|
|
|
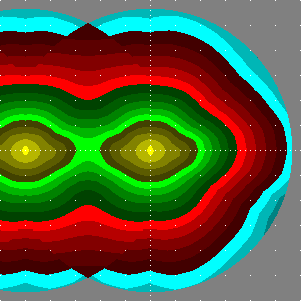
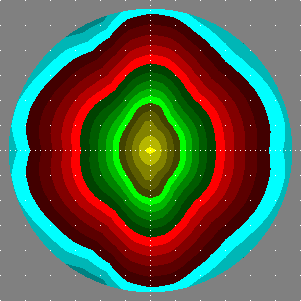
| In the left half of the left plot, specific illuminance by a continuous row of luminaires spaced 5 heights is shown (right half is for a single luminaire). | The right plot is for a single luminaire, unrotated. |

Values below the scale are illuminance / 1 lx. This is for (unrealistic) “unit” case that luminaires would have lamps producing 1 klm only, would be point-like and just 1 m over the terrain.
# [MANUFAC]   .hess
# [TEST]      9088
# [LUMINAIRE] TORONTO
# [LUMCAT]    10.04631.7200
# [DATE]      16.02.04/10.04.1997/fg |16.02.04 LUMCat
# down given: 100%
# out given: 78.5%
# tilt:  0.0
# [LAMP]      HME 80W
# Source file: ldt/Tor9088b.ldt
# Luminaire flux =   752 raw, for the given bulb(s) it would be  5712 lm,
#                   75.2 % of the bulb flux
# between 75 and 90:  0.0 % of the luminaire flux
#  - this part causes just GLARE in case of road lighting and similar purposes
# 80deg and above:  max  48.4 cd / 1000 lm ,  0.2 % of the luminaire flux
# 90deg and above:  max   0.9?cd / 1000 lm ,  0.0?% of the luminaire flux
# CutOff Type: IES_CutOff

#  Increase of Sky Luminance due to light going
#    from the luminaire difectly above horizon, as compared with the
#    luminance produced by the light dispersed from the ground:   0?%
#  Increase of Sky Luminance in Distant Places by light below 15.0 degrees
#    due to light going from the luminaire directly above horizon:   0?%
#  (for the zenith luminance such an angle suits places up to  19 km distance)
#   The increases concern the following situation:
#    Albedo = 0.10
#    Zenith Extinction = 0.30 mag (i.e., direct light remaining  76 %)
#    Indicatrix type =0 (0: acc. to P.Cinzano, 4..6: CIE sky types)
#   (the downward-scattered part of lambertian uplight is 0.1108 then)

# 62.5 deg to <67.5 deg:   max   -99 cd / 1000 lm,
# 67.5 deg to < 76  deg:   max   220 cd / 1000 lm,
# maximum spec. lum. intensity   346 cd / 1000 lm

# The following table gives luminous intensities which would be produced
# using a hypothetic bulb giving a luminous flux of 1000 lm (i.e., cd/klm):

#  H:   0.0  10.0  20.0  30.0  40.0  50.0  60.0  70.0  80.0  90.0 100.0 110.0 120.0 130.0 140.0 150.0 160.0 170.0 180.0
#V:
  0.0   223   223   223   223   223   223   223   223   223   223   223   223   223   223   223   223   223   223   223
 10.0   209   209   207   204   200   198   197   198   198   200   200   201   202   203   205   208   210   210   210
 20.0   176   177   178   177   176   179   182   186   189   192   192   191   189   187   186   186   187   185   185
 30.0   148   150   153   158   164   171   179   185   191   196   196   193   188   182   176   171   167   164   163
 40.0   132   133   139   149   163   177   187   191   203   219   221   209   192   182   171   162   155   153   153
 50.0   118   124   132   137   140   158   171   204   260   303   299   255   206   178   159   149   145   140   137
 60.0  90.9  95.3  99.7   104   105   112   133   206   306   346   306   238   170   133   123   119   117   113   109
 70.0  66.6  68.7  72.6  77.0  74.6  72.6  91.0   137   196   220   182   125  85.5  83.2  94.3   100  98.0  92.0  83.5
 80.0  29.0  33.5  33.0  30.1  25.9  23.9  27.2  31.8  45.7  48.4  41.6  18.9  18.4  26.2  27.2  32.1  37.7  37.7  28.2
 90.0   0.6   0.7   0.7   0.7   0.7   0.8   0.8   0.8   0.9   0.9   0.8   0.8   0.8   0.7   0.7   0.6   0.6   0.6   0.6