|
|
|
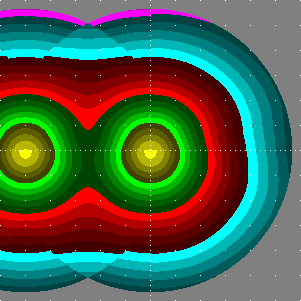
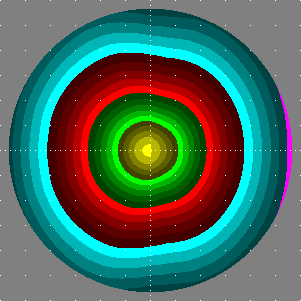
| In the left half of the left plot, specific illuminance by a continuous row of luminaires spaced 5 heights is shown (right half is for a single luminaire). | The right plot is for a single luminaire, unrotated. |

Values below the scale are illuminance / 1 lx. This is for (unrealistic) “unit” case that luminaires would have lamps producing 1 klm only, would be point-like and just 1 m over the terrain.
# [MANUFAC]   .hess
# [TEST]      NO45-20R
# [LUMINAIRE] NOVARA SL
# [LUMCAT]    12.02651.4500
# [DATE]      07.04.1997/fg
# down given: 100%
# out given: 55.7%
# tilt: 0.0
# [LAMP]      TC-L 24W
# Source file: ldt/NO45-20R.ldt
# Luminaire flux =   549 raw, for the given bulb(s) it would be  1975 lm,
#                   54.9 % of the bulb flux
# between 75 and 90:  0.0 % of the luminaire flux
#  - this part causes just GLARE in case of road lighting and similar purposes
# 80deg and above:  max  12.2 cd / 1000 lm ,  0.1 % of the luminaire flux
# 90deg and above:  max   0.8?cd / 1000 lm ,  0.0?% of the luminaire flux
# CutOff Type: CIE_CutOff

#  Increase of Sky Luminance due to light going
#    from the luminaire difectly above horizon, as compared with the
#    luminance produced by the light dispersed from the ground:   0?%
#  Increase of Sky Luminance in Distant Places by light below 15.0 degrees
#    due to light going from the luminaire directly above horizon:   0?%
#  (for the zenith luminance such an angle suits places up to  19 km distance)
#   The increases concern the following situation:
#    Albedo = 0.10
#    Zenith Extinction = 0.30 mag (i.e., direct light remaining  76 %)
#    Indicatrix type =0 (0: acc. to P.Cinzano, 4..6: CIE sky types)
#   (the downward-scattered part of lambertian uplight is 0.1108 then)

# 62.5 deg to <67.5 deg:   max   -99 cd / 1000 lm,
# 67.5 deg to < 76  deg:   max    57 cd / 1000 lm,
# maximum spec. lum. intensity   235 cd / 1000 lm

# The following table gives luminous intensities which would be produced
# using a hypothetic bulb giving a luminous flux of 1000 lm (i.e., cd/klm):

#  H:   0.0  10.0  20.0  30.0  40.0  50.0  60.0  70.0  80.0  90.0 100.0 110.0 120.0 130.0 140.0 150.0 160.0 170.0 180.0
#V:
  0.0   211   211   211   211   211   211   211   211   211   211   211   211   211   211   211   211   211   211   211
 10.0   175   176   178   180   183   187   190   196   203   224   229   225   225   228   230   233   234   232   235
 20.0   158   158   161   164   167   172   175   181   189   208   215   216   218   221   226   230   232   233   235
 30.0   137   138   139   141   143   148   153   157   165   186   192   195   199   204   210   213   216   220   222
 40.0   127   127   127   125   122   121   125   130   138   153   161   166   170   174   183   187   192   195   197
 50.0   100   101   102   102   101  99.1  94.7  97.2   103   114   122   129   134   140   147   150   153   154   155
 60.0  67.5  68.3  70.9  71.8  70.4  69.3  67.9  63.5  65.0  73.5  80.3  88.4  94.0  97.3   102   105   108   108   108
 70.0  33.5  33.3  34.4  35.4  36.0  37.2  36.0  33.5  30.9  34.7  40.2  46.6  49.6  52.3  55.6  57.4  56.6  54.2  53.8
 80.0   4.4   4.8   5.4   6.3   7.2   7.9   8.6   8.5   7.3   6.9   9.0  11.4  12.2  11.3  10.3   9.3   8.8   7.8   7.8
 90.0   0.6   0.6   0.6   0.5   0.4   0.4   0.4   0.4   0.4   0.7   0.8   0.4   0.4   0.4   0.4   0.4   0.4   0.4   0.4