|
|
|
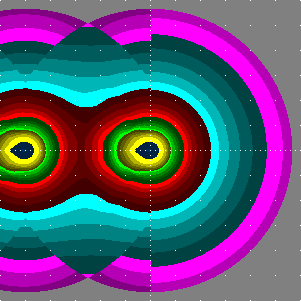
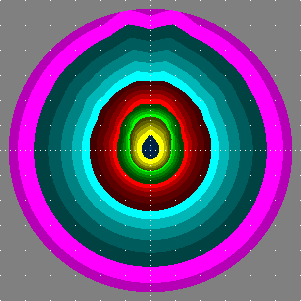
| In the left half of the left plot, specific illuminance by a continuous row of luminaires spaced 5 heights is shown (right half is for a single luminaire). | The right plot is for a single luminaire, unrotated. |

Values below the scale are illuminance / 1 lx. This is for (unrealistic) “unit” case that luminaires would have lamps producing 1 klm only, would be point-like and just 1 m over the terrain.
# [MANUFAC]   .hess
# [TEST]      358/NO45-02R
# [LUMINAIRE] NOVARA Q
# [LUMCAT]    12.02633.0
# [DATE]      23.12.03/24.11.1995/KLAISS |23.12.03 LUMCat
# down given: 100%
# out given: 72.2%
# tilt:  0.0
# [LAMP]      HIT-DE-CE 150W
# Source file: ldt/N4502rbi.ldt
# Luminaire flux =   720 raw, for the given bulb(s) it would be  9722 lm,
#                   72.0 % of the bulb flux
# between 75 and 90:  0.0 % of the luminaire flux
#  - this part causes just GLARE in case of road lighting and similar purposes
# 80deg and above:  max   4.0 cd / 1000 lm ,  0.2 % of the luminaire flux
# 90deg and above:  max   1.0?cd / 1000 lm ,  0.0?% of the luminaire flux
# CutOff Type: CIE_CutOff

#  Increase of Sky Luminance due to light going
#    from the luminaire difectly above horizon, as compared with the
#    luminance produced by the light dispersed from the ground:   0?%
#  Increase of Sky Luminance in Distant Places by light below 15.0 degrees
#    due to light going from the luminaire directly above horizon:   0?%
#  (for the zenith luminance such an angle suits places up to  19 km distance)
#   The increases concern the following situation:
#    Albedo = 0.10
#    Zenith Extinction = 0.30 mag (i.e., direct light remaining  76 %)
#    Indicatrix type =0 (0: acc. to P.Cinzano, 4..6: CIE sky types)
#   (the downward-scattered part of lambertian uplight is 0.1108 then)

# 62.5 deg to <67.5 deg:   max   -99 cd / 1000 lm,
# 67.5 deg to < 76  deg:   max     9 cd / 1000 lm,
# maximum spec. lum. intensity   541 cd / 1000 lm

# The following table gives luminous intensities which would be produced
# using a hypothetic bulb giving a luminous flux of 1000 lm (i.e., cd/klm):

#  H:   0.0  10.0  20.0  30.0  40.0  50.0  60.0  70.0  80.0  90.0
#V:
  0.0   541   541   541   541   541   541   541   541   541   541
 10.0   415   421   424   436   450   466   487   506   525   534
 20.0   369   373   388   390   404   404   423   455   493   520
 30.0   274   294   310   332   383   379   398   415   477   540
 40.0  49.0  56.0  74.9   129   176   273   313   332   381   464
 50.0  19.0  19.0  19.0  23.0  40.0  62.0   133   175   202   225
 60.0   8.0   9.0   9.0   9.0  12.0  15.0  21.0  31.0  38.0  35.0
 70.0   5.0   5.0   5.0   5.0   6.0   6.0   7.0   8.0   9.0   8.0
 80.0   3.0   3.0   3.0   3.0   3.0   3.0   3.0   3.0   4.0   3.0
 90.0   1.0   1.0   1.0   1.0   1.0   1.0   1.0   1.0   1.0   1.0