|
|
|
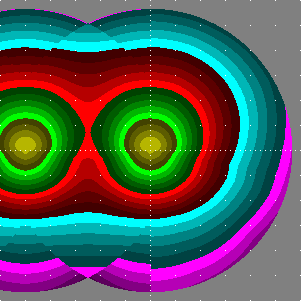
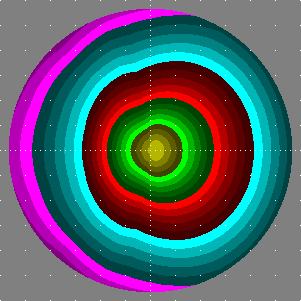
| In the left half of the left plot, specific illuminance by a continuous row of luminaires spaced 5 heights is shown (right half is for a single luminaire). | The right plot is for a single luminaire, unrotated. |

Values below the scale are illuminance / 1 lx. This is for (unrealistic) “unit” case that luminaires would have lamps producing 1 klm only, would be point-like and just 1 m over the terrain.
# [MANUFAC]   .hess
# [TEST]      NO26-06R
# [LUMINAIRE] NOVARA L
# [LUMCAT]    12.72600.0
# [DATE]      22.12.03/09.04.1997/fg |22.12.03 LUMCat
# down given: 100%
# out given: 39.7%
# tilt:  0.0
# [LAMP]      TC-D 26W
# Source file: ldt/N2606rai.ldt
# Luminaire flux =   393 raw, for the given bulb(s) it would be   707 lm,
#                   39.3 % of the bulb flux
# between 75 and 90:  0.0 % of the luminaire flux
#  - this part causes just GLARE in case of road lighting and similar purposes
# 80deg and above:  max   7.8 cd / 1000 lm ,  0.2 % of the luminaire flux
# 90deg and above:  max   0.6?cd / 1000 lm ,  0.0?% of the luminaire flux
# CutOff Type: CIE_CutOff

#  Increase of Sky Luminance due to light going
#    from the luminaire difectly above horizon, as compared with the
#    luminance produced by the light dispersed from the ground:   0?%
#  Increase of Sky Luminance in Distant Places by light below 15.0 degrees
#    due to light going from the luminaire directly above horizon:   0?%
#  (for the zenith luminance such an angle suits places up to  19 km distance)
#   The increases concern the following situation:
#    Albedo = 0.10
#    Zenith Extinction = 0.30 mag (i.e., direct light remaining  76 %)
#    Indicatrix type =0 (0: acc. to P.Cinzano, 4..6: CIE sky types)
#   (the downward-scattered part of lambertian uplight is 0.1108 then)

# 62.5 deg to <67.5 deg:   max   -99 cd / 1000 lm,
# 67.5 deg to < 76  deg:   max    58 cd / 1000 lm,
# maximum spec. lum. intensity   202 cd / 1000 lm

# The following table gives luminous intensities which would be produced
# using a hypothetic bulb giving a luminous flux of 1000 lm (i.e., cd/klm):

#  H:   0.0  10.0  20.0  30.0  40.0  50.0  60.0  70.0  80.0  90.0 100.0 110.0 120.0 130.0 140.0 150.0 160.0 170.0 180.0
#V:
  0.0   156   156   156   156   156   156   156   156   156   156   156   156   156   156   156   156   156   156   156
 10.0   202   201   198   197   192   187   180   170   160   153   126   124   121   120   121   119   119   119   124
 20.0   201   200   198   198   193   187   178   167   154   143   116   111   106   102  99.7  96.8  96.0  94.7  98.6
 30.0   186   186   185   182   179   174   167   155   141   126   101  93.2  87.1  83.2  79.3  76.3  76.2  75.4  79.1
 40.0   170   169   168   165   159   151   143   133   118   103  80.1  72.4  66.8  64.7  64.2  64.2  64.5  63.9  67.1
 50.0   143   144   143   140   132   123   113   102  90.0  75.4  56.4  50.8  48.0  50.0  50.5  48.9  47.5  46.8  47.8
 60.0   110   109   108   104  95.0  87.9  77.8  67.0  56.4  45.6  33.6  31.2  32.9  32.5  30.8  29.3  27.5  26.8  26.4
 70.0  56.5  56.0  57.8  55.8  52.7  47.5  40.3  33.5  26.1  19.8  15.2  16.3  14.8  13.3  10.9   9.6   8.3   7.9   7.8
 80.0   6.9   6.8   6.9   7.2   7.7   7.8   7.7   6.3   4.8   3.7   3.2   2.8   2.1   1.6   2.0   2.2   2.3   2.5   2.6
 90.0   0.4   0.4   0.4   0.4   0.4   0.4   0.4   0.4   0.4   0.4   0.4   0.4   0.4   0.4   0.6   0.6   0.6   0.6   0.6