Photometric overview of partial lunar eclipse, Sep 7, 2006
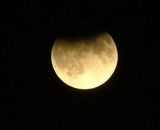
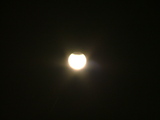
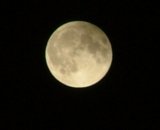
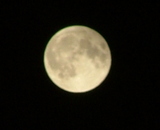
Images have been taken with Fuji S5000, on the Nicholas Copernicus
Observatory and Planetarium in Brno, Czech Republic. Detailed views of
the Moon were made with focal length 57 mm (35mm equivalent: 386mm),
wide-angle views with ten times shorter focal length. Exposure times
for showing the Moon are mostly 1/125 s or 1/30 s (and
aperture f/9), exposure times for showing the sky and occulted lunar rim
were mostly 2 s (images with diffraction spikes are f/9, those
without them are f/2.8).

Logarithmic scale of luminance / 1 cd/m2
(i.e., the unit is candela per square metre). Each small step within
particular colour represents 0.5 mag in the astronomical parlance.
Grey colour in the images below, in their underexposed noisy parts, means
absence of usable signal, even when 16 adjacent pixels are averaged.
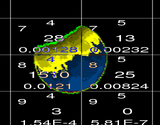
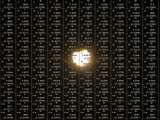
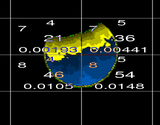
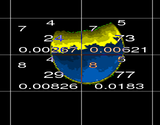
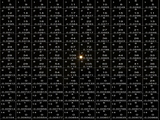
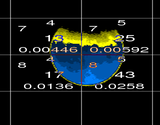
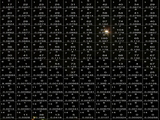
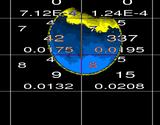
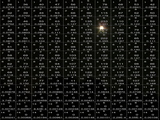
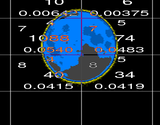
In the grids shown in the images, the central numbers are medians of
green pixels (just an auxiliary value, in fact). The numbers at the
bottom have two alternative meanings. For details of Moon, they are
luminous flux densities from the individual grid tiles (i.e., tile
brightnesses) in lumens per square metre. For long exposure times, the
bottom numbers are the average luminances of the tiles, which can be
directly compared with the colour-coded images.
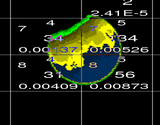
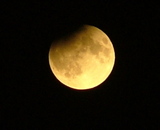
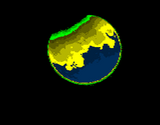
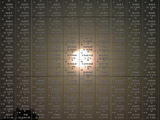
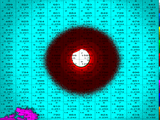
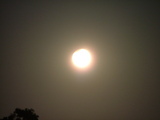
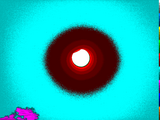
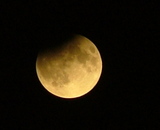
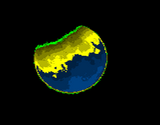
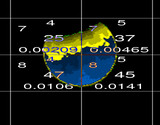
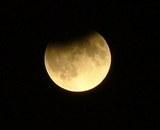
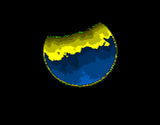
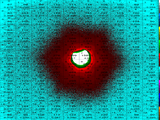
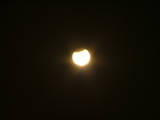
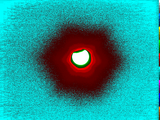
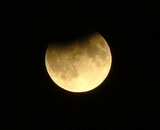
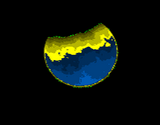
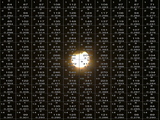
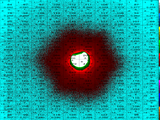
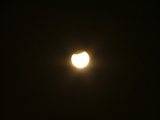
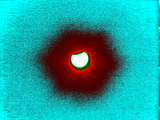
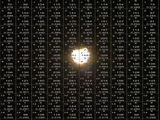
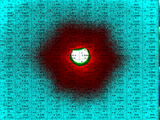
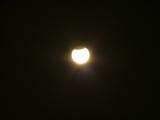
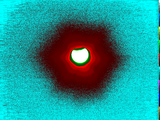

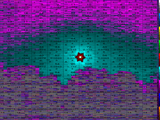
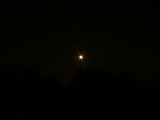
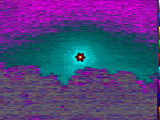
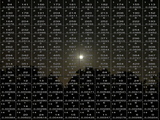
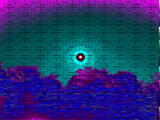
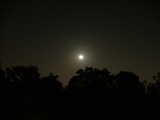
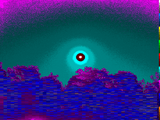
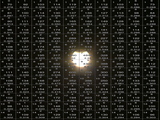
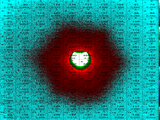
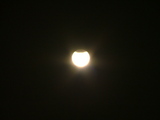
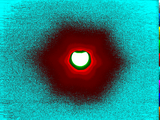
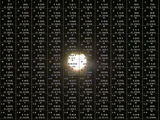
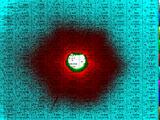
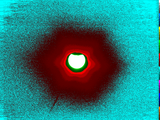
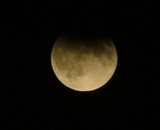
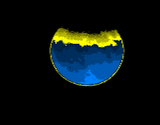
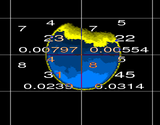
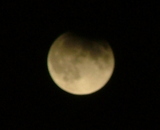
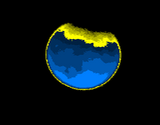
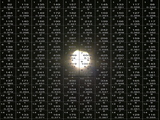
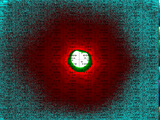
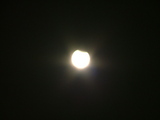
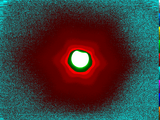
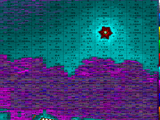
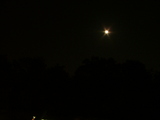
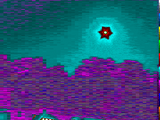
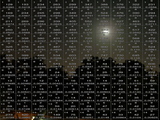
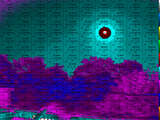
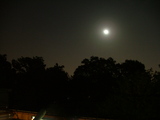
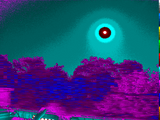
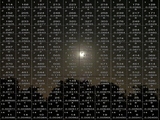
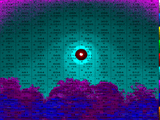
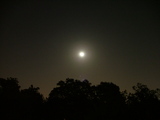

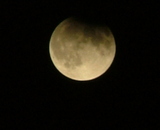
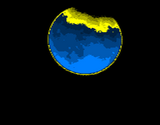
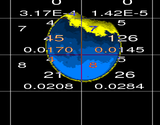
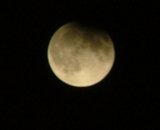
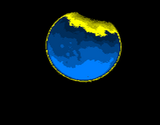
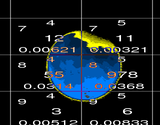
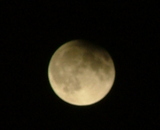
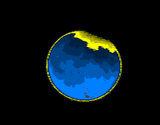
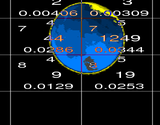
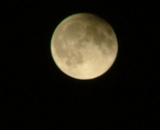
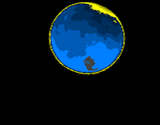
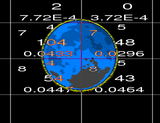
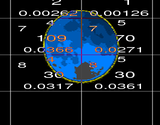

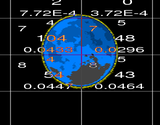
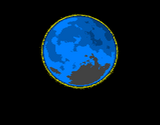
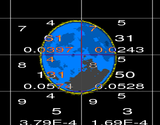
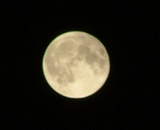

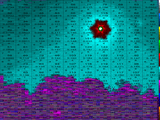
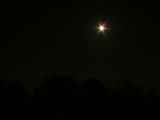
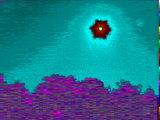
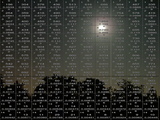
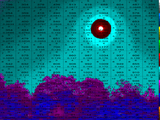
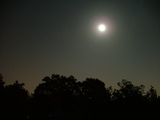
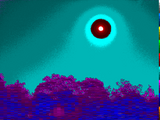
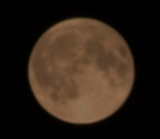
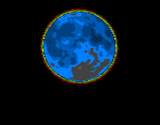
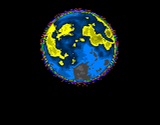

The last view is shown in several other ways. The normal image is
from dcraw using -b 0.15 option, two other false-colour images have
more detailed scales – instead of 1/2 mag it is either
1/4 mag or even 1/8 mag. The basic grey remains at the same
level, 4000 cd/m2. The image was taken at 20:27 UTC, when
the upper right rim of the moon was still twenty minutes before escaping
the semishadow.
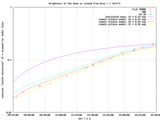
The graph shows the brightness of the Moon, as measured from detailed
images, and by the Sky Quality Meter, or even a luxmeter (Extech EA 30). When using
SQM or a luxmeter, two readings were taken: one taking the total light,
the other when a lunar shadow was casted onto the sensor. The shadow
was a minimum possible one (a thumb or a lid far from the sensor).
Total light was measured (mostly...), when the same shadow was just
adjacent to the sensor (to block a similar part of the sky as that with
the Moon). Theoretical curves are made using a very simplified model of
semishadow, a quick hack to my planet.pas programme (its standard
non-eclipse version is accessible online as lun_illum.php within
http://amper.ped.muni.cz/jenik/astro/). A probable interpretation of
the graph is, that the atmospheric transparency varied in the course of
the eclipse.
This lunar eclipse was too low in the sky to present a good
possibility for photometric calibration of digital cameras. If it would
be a winter eclipse, high in the sky, then extinction variations would
play far lower role. Calibrating many cameras over Europe (or even east
US coast) relying on that used by me would be then possible quite well.
Some overview of the employed method is available as an August
lecture in Commision 50 of the IAU in Prague,
see 06IAU50t_small.pdf (8 MB) within
http://amper.ped.muni.cz/light/lectures/. Another info is in
../../ directory.
Jeník Hollan


