See the directory including the data in the other format
|
|
Go to a readable photometry table See the directory including the data in the other format |

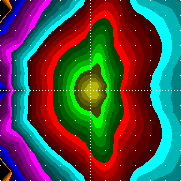
Values below the scale are illuminance / 1 lx. Default (unrealistic) “unit” case is for luminaire being point-like, just 1 m over the terrain and containing a lamp producing exactly 1 klm. A realistic height can be given as a parameter, then the lamp flux given in the photometric file is used, if not overriden by a parameter.
If a continuous row of luminaires is computed, the result is shown at the left side. At the right side, illuminance produced by a single luminaire remains. Default spacing of luminaires is five pole heights. White marks are spaced one pole height, marks on axes are five times denser (0.2 height).