See the directory including the data in the other format
#FiOut 75-90 >= 80degrees    >= 90degrees      CutOff?        filename
#  %    %    cd/klm % Out  cd/klm % Out % I.D.L.P.
curr_lum.ies exists!
  99.9  6.1  201.8   1.7    0.7?  0.0?   0?  Non-CutOff       curr_lum.ldt
ies_view_php.sh http://amper.ped.muni.cz/light/ies2/innolumis/photom_files/bat9.ldt -cm6 -co -rh3 -cs -rv-90 -h5
|
|
Go to a readable photometry table See the directory including the data in the other format |

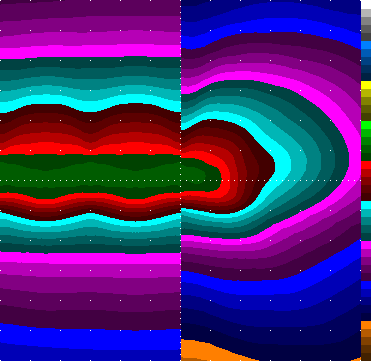
Values below the scale are illuminance / 1 lx. This is for the case that the luminaire is 5 m over terrain and the spacing of luminaires is 3 heights, i.e., 15 m. As you see, the illuminance is very uniform in a band width of 1.2 luminaire heights, i.e., 6 m.
The result for a continuous row of luminaires is is shown at the left of the plot. side. At the right side, illuminance produced by a single luminaire remains. White marks are spaced one luminaire height, marks on axes are five times denser (0.2 height).