The world market offers hundreds of types of outdoor luminaires. Such luminaires can be often used with various lamps (bulbs) in varying positions, moreover the mirrors inside luminaires can be moved to change the distribution of outcoming light somewhat; if compound, mirrors can be even shaped as needed for the particular site.
So, there are tens, or rather hundreds of thousands basic light distributions available for outdoor lights. Those from reliable luminaire manufacturers are freely available on internet as files describing photometric properties of each configuration. Photometric properties are expressed as specific luminous intensities in many directions. Let's remind that luminous intensity unit is candela, one of the basic SI units, by specific intensity a ratio of luminous intensity to the light flux from the bulb(s) inside the luminaire is understood; conventionally, it is expressed not in cd/lm, but in cd/klm, candelas per kilolumen. IES or Eulumdat formats are the most usual ones for the photometric files.
The designer should select those files which suit the best the given purpose: artificial lighting of some area, with some target light conditions wished there, and as little light going elsewhere as possible. And of course, with minimum power consumption. The positions of luminaires can be entirely prescribed (new luminaires will be used at the place of old ones, using the same supporting structure), partly adaptable (e.g., arm lengths can be changed), or can be chosen rather freely.
As the world market is large and evolving, making the best use of it is not easy. No wonder that most light designers consider those products of just one or several manufacturers which they know well already, neglecting another luminaires which may serve the purpose much better.
Environmentalists who want to mitigate the climate change and who want to protect the night environment against man-made light have another priorities than using their favourite luminaires again and again. Any light outside the adequate target areas, and any more light than really necessary even to those target areas, is a pollution (and causes fossil carbon emissions) which should be avoided by optimising the lighting system geometry and minimising power consumption. No wonder, that at least three of them have developed software to make this true.
Diego Bonata developed a programme (see http://www.savethesky.eu) which is aimed mainly at optimising the supporting structure geometry (pole positions, overhangs) using some pre-selected group of luminaire photometries. Some luminances of the road and upper limits for glare (taken from some technical standard) is what is meant by the target light conditions, assuming some reflective properties of the ground (neglecting glare from any other sources than the luminaires themselves, this is the way the current technical standards work...).
An important part of this software package is a database of those luminaire photometries, which have no or very little emissions horizontally and upwards – which conform to good environmental legislation, wherever it exists regarding outdoor lighting. Bonata got the photometry files from 15 manufacturers, and hopefully more will offer their data to him soon.
Has been the first software for a thorough analysis of lighting installations and the evaluation of their environmental impact due to light pollution, developed by Pierantonio Cinzano. It's a definitive tool to evaluate contributions of differing lighting systems to skyglow, in a flat terrain, see http://www.lightpollution.it/roadpollution.
My programme ies2tab offers another output. The original goal (in 2001, when the first version of ies2tab has been published) was to produce human-readable texts (table) from *.ies files, as the programme's name reminds. But basic parameters characterising the luminaire photometric properties have been computed too, e.g. those which are relevant for categorising the luminaire according to the IES or CIE classes (their names contain the string “cutoff” with various prefixes). The programme did that classification easily, by producing an optional one-line output. Summary values for thousands of luminaire variants could be put into a single text file this way (just appending lines from ies2tab runs) and then sorted according to any parameter.
Soon afterwards, computation of a contribution of direct light from luminaires to skyglow was added, and of a proportion of luminaire flux which hits a given rectangle.
Then Eulumdat format reading and writing (or IES format writing); no converters between those two formats existed for unix platforms before, not to speak about being under GNU license (and therefore open-source, verifiable and correctable).
Comparing thousands of photometries as to their skyglow contribution became possible, as well as searching for the best luminaires to illuminate a given rectangular area.
In 2007, a colour-coded image output has been added, showing the illuminance of the ground in a logarithmic scale. This was extended by an option to compute a result for an equidistant row of lights as well, as this is the way most outdoor luminaires are employed. (The employed colour scale has been taken from another programme by me, raw2lum, for photometric evaluation of images by digital cameras using raw formats). Scripts for making thumbnail overviews of thousands of luminaires have been built on ies2tab, as well as html overviews of single luminaires and their rows – results for many producers have been put onto the programme's web, http://amper.ped.muni.cz/light/ies2/. Visual comparison of illuminance thumbnails (different sizes may be produced) may be a quick way how to select photometries which are promising for some lighting task.
That part of the code was later extended to compute the illuminance of a given rectangle more accurately. Scripts for automatic selection of most suitable photometric files have been written, see some results within http://amper.ped.muni.cz/light/ies2/EasyLight-SaveTheSky/ based on the database compiled by Diego Bonata. I dare say that for an existing lighting system in which the luminaire positions cannot be changed, a script like my rect_ilc.sh is the only tool which is needed to design an optimal regular single-sided row of luminaires (apart from eventual further sorting of its output file according to another parameters, but this is easily done by a standard sort programme as available in linux etc.).
ies2tab is an engine with many possibilities. The most comfortable way of using it is through some shell scripts which choose what to do themselves. But let's say what are the basic products of the engine.
The easiest is one is that for a single luminaire – an overview line like this:
#FiOut 75-90 >= 80degrees    >= 90degrees      CutOff?        filename
#  %    %    cd/klm % Out  cd/klm % Out % I.D.L.P.
  76.0  3.3   37.8   0.4    0.0   0.0    0   Full_CutOff      Ge8595.IES
It says that 76 % of bulb flux gets out of luminaire altogether, 3.3 % goes to rather non-wanted directions between 75 degrees from nadir and 90 degrees from it, maximum specific luminous intensity at 80 degrees or above is 38 cd/klm (and just 0.4 % of light emissions go there), and finally, that zero light emissions are guaranteed at horizontal and upward directions – therefore, their contribution to the increase of light pollution in distant areas are zero per cent (relative to pollution caused by the light dispersed there from the lit ground). As the <0.50 cd/klm limit is obeyed at 90 degrees and above, the Full cut-off category of IESNA holds for the luminaire.
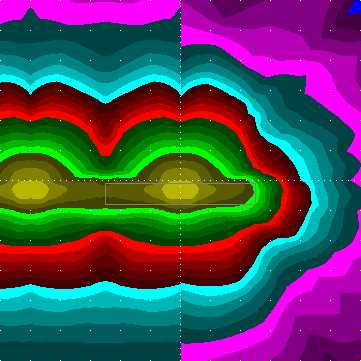
Using a -n parameter, a plot of the ground illuminance can be produced. The basic plot is made just to illustrate the geometric properties of the luminaire (so that luminaires can be compared disregarding how strong a lamp is inside them). Luminaire height is assumed to be 1 m over the ground and the lamp flux to be 1 klm (one thousand lumens) – or equivalently, height of 10 m and lamp flux 100 klm (well, that's a lot...).
Such a plot is more telling than a text output, namely a table of the specific luminous intensities (specific: assuming a 1 klm lamp), which is the default output of ies2tab (making ies files human-readable). The plot contains a grid of dots spaced just one pole height, on axes it's 1/5 pole height. The luminaire is over the centre of the plot, 6 pole heights from its sides.
Illuminances are colour-coded in a logarithmic scale; a logarithmic scale is adequate for human vision, as our perception is logarithmic as well. Moreover, it enables showing vastly different illuminances in a single plot, spanning many orders of magnitude.
Apart from “unit case” illuminance, real illuminance can be shown, when some real luminaire height is given by the -h# parameter. The lamp flux is taken from the photometric file, or it can be overridden (if you are interested, say, just in 50 W lamps emitting 4.4 klx) by setting the lamp flux. E.g., for 6 m the and 4.4 klx the parameter would be -h5:4400 in such a case.
As the luminaires are arranged mostly in rows with constant spacing, an option to show illuminance by such a row is included; this is demanded by an -co parameter (co as continuous). Default relative spacing is 4 (distance between poles / pole height), this can be changed by a -rh# parameter.
Plotting an illuminance by a continuous row of luminaires is a bit tricky: this is due to the fact that the proper orientation of the luminaires is to be chosen. Namely that one, in which the luminaires shine mainly along the row (i.e., street or road). In most cases, it needs a 90-degree (or 270 degree) rotation of the coordinate system around a vertical axis. But esp. within the Eulumdat format, the proper orientation of the coordinate system for reporting the luminous intensities is often not confused by the manufacturers. Because of that, a proper rotation is to be verified. Fortunately, the plot reveals quickly if the rotation was chosen OK. See a huge unsorted overview of specific illuminance plots for thousands of luminaire photometric files (sometimes not properly oriented) as http://amper/light/ies2/EasyLight-SaveTheSky/all_5.htm, or an overview sorted on maximum specific luminous intensity about 70 degrees from nadir, http://amper/light/ies2/EasyLight-SaveTheSky/all_5.htm. A small piece from its inside is here (the thumbnails link to html files with more and larger plots and a full text output regarding those luminaires).
Plots of illuminance code continuous lighting in their left half and just the contribution of the single central luminaire in their right half.
The simplest way to arrive at some guess how a luminaire will perform with regards to a particular geometry of pole and street is to look at the illuminance plot and imagine how the street would go. Street can be represented as a strip, and as regards a single luminaire, a rectangle along the street is what is the relevant reference area. A lengthy rectangle of such size, that its length is the same as the spacing of the poles with luminaires.
ies2tab computes perhaps since 2001 some summary values regarding illuminance of such a rectangle: how large proportion of luminaire's light hits that area (a relative useful flux), what is the maximum, average and minimum illuminance there. What is the ratio of minimum to average – characterising the uniformity of illumination.
              FiOut 75-90 >= 80degrees    >= 90degrees     65   70  abs.   CutOff?   useful/Out Illum/lx(1m,1klm)       filename
                %    %    cd/klm % Out  cd/klm % Out % ILP.  max. cd/klm                    %    max    av   min  av/min
 2:   65.0  1.2   10.2   0.4    0.0   0.0    0    702  650  702  Full_CutOff     46.6  197.8  82.0 39.2   2.1 RRA444
Computing such a line for many photometric files enables sorting the best-perfoming ones, as regards the above parameters. Those giving maximum uniformities and maximum relative useful flux might be the best ones for the purpose. It might be good having as low maxima as possible, too as any more light than that in minimally illuminated spots is unwanted, hindering visibility in those minima.
Currently, ies2tab computes such parameters even for rows of lights, this is the case of the above line. The whole small overview from which it is taken is http://amper.ped.muni.cz/light/ies2/EasyLight-SaveTheSky/r-2.5_2.5_-0.8_-0.1_os2.htm (the numbers concern the dimensions of the rectangle, os2 means it's the second, reduced selection for a village Ostopovice).
A bash script (running in linux and another unix's) rect_ilc.sh does the job of making a sorted overview. Running it twice (second time with narrow ranges for the wanted parameters) might bring a fairly narrow selection of luminaires suitable for a given lighting task.
The script decides the proper rotation of the luminaire's photometry to put as much light as possible to the target rectangle. The needed rotation is coded as a first number in the output line. Luminaires needing strange rotations (not of themselves, but of photometry data) may fail to perform well in another programmes, in spite of having excellent photometric properties.
I plan to put the script online soon, so that anybody would be able to choose the optimum luminaires from the EasyLight database. Those computed overviews with not too large size would then be prepared for another users to read,
Evidently, EasyLight database contains just a fraction of the world market of luminaires with zero emission horizontally and above. And it lacks the newest products, as those with glass with modern glass-only antireflective treatment. Even my directory http://amper.ped.muni.cz/light/ies2 contains photometries from some other manufacturers which should be pooled to the database.
Just then the illuminance optimisation runs might be said to represent the proper solutions.
The conventional photometry files have been measured with strong light sources, mostly 70 W or more. However, for many lighting tasks, esp. taking into consideration the need of reducing light pollution and mitigating climate change, lamps with less wattage are of concern. 50 W HPS ones, of course, but also 35 W ones, or even 18 W LPS ones. And CFL ones, down to 5 W. This is what is not available now, and, unfortunately, for LPS or CFL, the photometry made with a more compact HID burner cannot be simply scaled down. Luminous intensity maxima and minima obtained with compact light sources will get less pronounced when the light source will be larger. Fortunately, with large luminaires and really low-wattage lamps this will be not so bad. Still, real photometric data for low-wattage lamps are needed. For illuminance at the level of 0.6 lx to several lux. At the moment, we can just guess which fixtures would perform good, and try if they will really.
Fortunately, there is a field method to verify it. Namely, taking a digital image of the illuminated area, without any need for a photometric laboratory. This is also the way of measuring the outcome of various additional shields, redirecting the light from unwanted directions to perhaps useful ones. I have an example of that, and will describe it soon, hopefully.
Jenik Hollan, Oct. 2007